Home > Using Cascade Planning > Data Entry Shortcuts
Data Entry Shortcuts
Last Updated 3/21/2011 2:32 PM
When inputting data into a Maxiplan spreadsheet, there are a number of shortcuts that make data input easier. These shortcut codes are:
This section provides you with examples on using the shortcut input facilities.
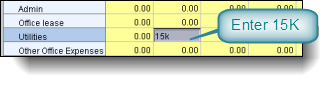
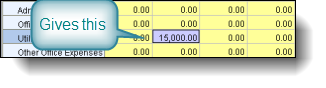
The K and M codes can be used to enter values in 1000's (K) or 1,000,000's (M). For example if we wish to enter 15,000 into a cell, we can enter 15K which would give the same result. Similarly if we wanted to enter in 22,000,000, we could simply enter the value as 22M which achieves the same result.
You can use the K and M codes after any value in combination with the other codes below.
When you input a value if you append a '%' symbol to the value on input, it will be treated as a percentage and stored in the grid as a percentage. For example if you enter the number 10% it will be stored as a percentage (divided by 100). The % code can be used with any of the following where a value is specified.
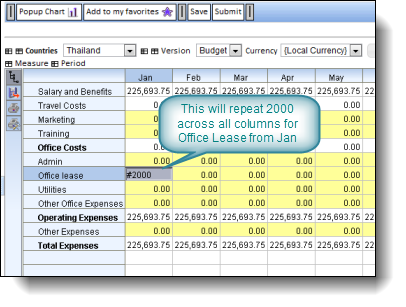
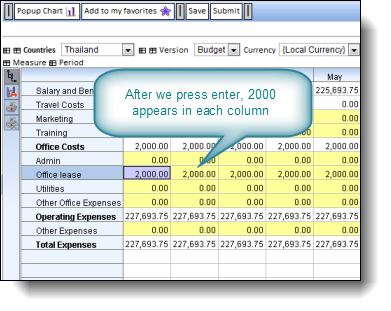
The # character code is used to repeat the same data across multiple columns after the input column. If the # is preceded by a number the value after the # is repeated that number of times. If no number precedes the #, then the value will be repeated for all columns after the input cell.
For example:
4#2500 will repeat the value 2500 for 4 columns from the input cell.
#2500 will repeat the value 2500 for all columns from the input column onwards.
The snapshot below shows how we can repeat the value “2000” into all the columns using the # keyword.
Different repeating values can be specified through one input. We just separate them with a comma.
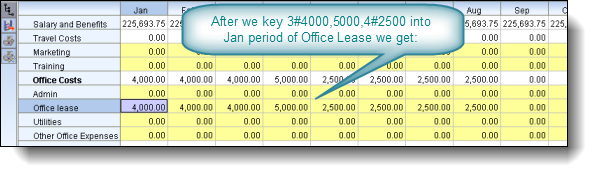
So for example if we enter 3#4000,5000,4#2500 into a cell we will end up with 4000 in three columns, 5000 in the next column after that, and then 2500 in the next four columns after that.
The keyword G is use if we want to generate a geometric or compound growth series from a base starting value across subsequent columns. The base value precedes the code G and the growth rate follows after the code G. The growth rate can be specified as a decimal fraction or if we add the '%' character it can be specified as a percentage.
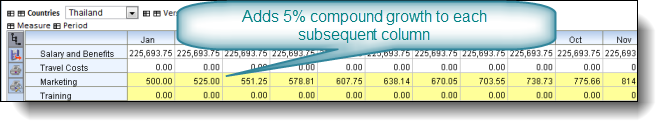
For example, 2000G.10 places 2000 in the first cell, then 2200 in the next cell, 2420 in the next cell and so on until the end of the row. We could also enter 2000G10% and this would give the same result.
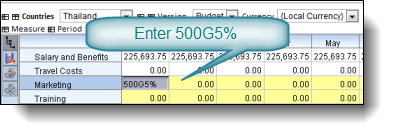
In the example below our Marketing budget starts at 500 and we grow it by 5% compound for each subsequent month. We have keyed in 500g5% into January column and the February to December columns have been set accordingly.
Similar to the code G format, the A code generates Arithmetic or Straight Line growth from a base value. As with the G code, the base value precedes the code (in this case A), and then the growth rate is specified after the code A.
For example 1000A10% would place 1000 in the starting column, followed by 1100 in the next column, 1200 in the next column and so on.
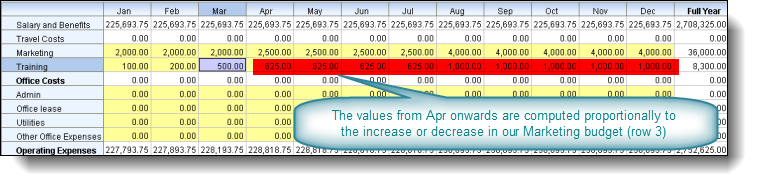
Using the code R for Relative (to another row)
The code R generates a series of values from a base value relative to another row in the displayed grid. The format is base-valueRrelative-row.
The base value precedes the code R and the relative row is input after the code R. The relative row will use the data in the row identified by the relative row to proportionally adjust the values after the base value.
Let's suppose we wanted to make our Training budget from March onwards proportional to our Marketing budget starting with a base value of 500:
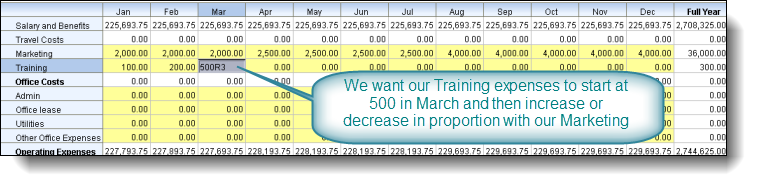
This would result in the following values to be created from Apr onwards:
You can enter simple calculations into any input cell using arithmetic operators +,-,*,/ and ().
The calculation expression must be preceded by an '=' character.
For example if you enter:
=78/10 the cell will have a resulting value of 7.8
=20*10 the cell will have a resulting value of 200
If the expression starts with an operator (e.g. +,-,*,/) then the current contents of the cell is assumed to be the first operand.
For example if you enter:
=*1.10 this will take the current value of the cell and multiply it by 1.10 (effectively applying a 10% increase)
=/12 this will take the current value of the cell and divide it by 12
=-10 this will take the current value of the cell and subtract 10
Let's suppose you wanted to increase an annual figure but wanted the revised figure to be allocated back to each of the months making up that annual figure based on the existing data profile. This is a simple exercise in Maxiplan.
You can enter values and expressions into a total cell in a grid and if the expression is a summation (such as a total for the year), Maxiplan will allocate the new total value across the supporting cells in proportion to their current values.
In the example below, our Marketing budget is 36,000:
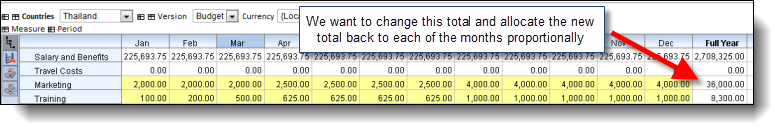
Let's say we wanted to make this marketing total 40,000. We can simply enter in a new value in the total cell, say 40K:
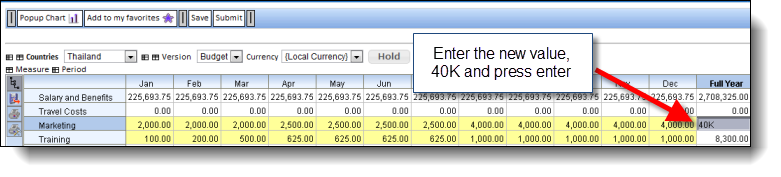
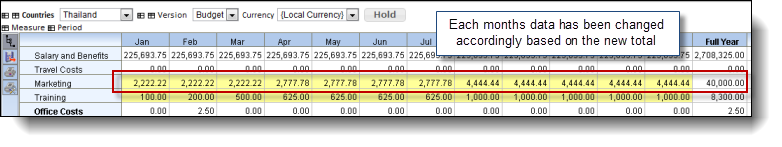
The value is changed to 40,000 and the monthly data is changed proportionally:
You could also enter an expression. Let's say for the same example above we wanted to apply a 20% increase to our Marketing budget. We simply enter in the expression '=*1.20' or alternatively '=*120%' which will apply a 20% increase to the existing value:
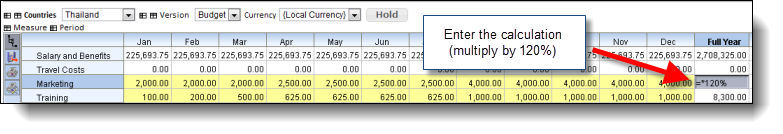
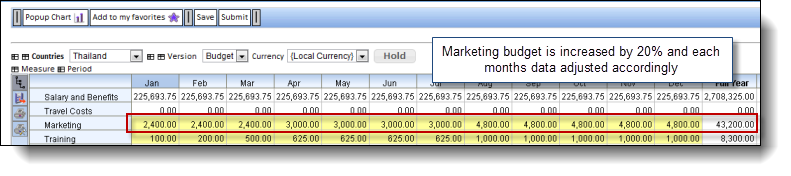
This results in the Marketing budget being adjusted accordingly:
Note that when inputting a value or expression into a total column, if the input cells that support it are all zeros, then the value will be allocated evenly across those cells. This is a very useful feature when you want to input an annual total as the system will allocate this back to the months evenly. Similarly for data entered into quarters it will be allocated back to the months that make up those quarters.
This facility to allocate backwards is not restricted to column totals, it can also be applied to row totals. For example in the screen below, our Office Costs we can see is a summation of Admin + Office Lease + Utilities + Other Office Expenses:
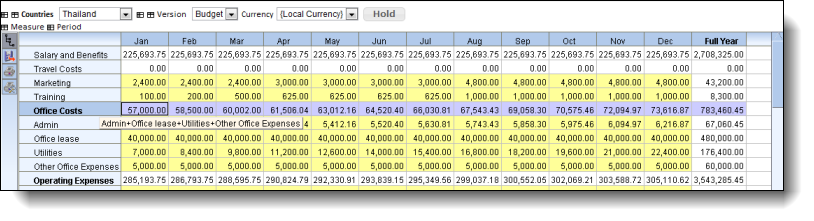
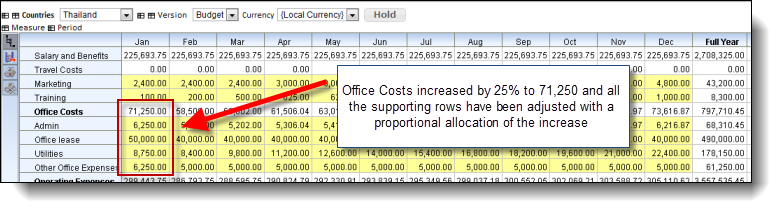
Let's say we wanted to increase our 'Office Costs' for January by 25%, we could enter into the 'Office Costs' for Jan cell, the expression '=*1.25' and press enter. This would increase our 'Office Costs' for Jan to 71,250, and this amount would be allocated to each of the Jan cells for 'Admin', 'Office Lease', 'Utilities' and 'Other Office Expenses' proportionally.
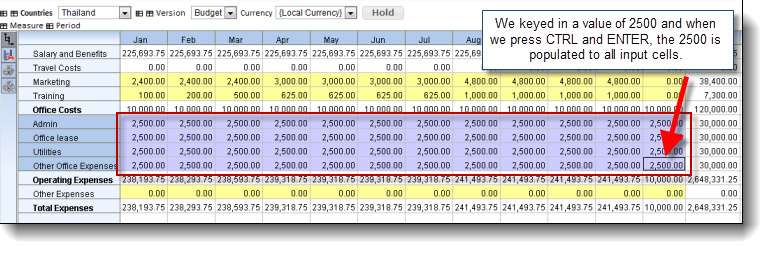
Entering the same value into a block of rows and columns
You can enter the same value into a block of input rows and columns. You can only do this over a contiguous block of input cells. To do this:
1. Drag your mouse over the block of cells you want the value to be entered for, so that the block is highlighted. The last cell that you dragged your mouse over will be highlighted with a rectangle:
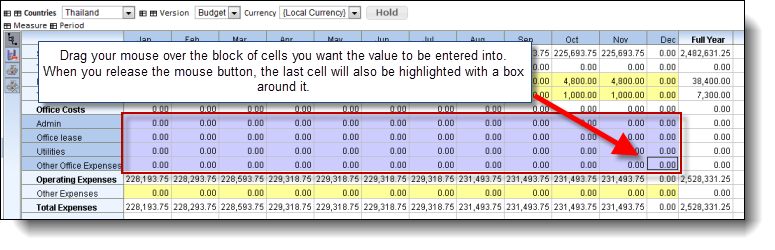
2. After releasing the mouse button, using the keyboard type in the value or expression you want entered into all the cells, BUT DO NOT PRESS THE ENTER KEY, but press the CONTROL and ENTER. The block will be filled with the desired value (in the example below we entered 2500 as the value:
See also
| 

 Page URL: