Home > Working with Planning Projects > Project Management > Virtual Period Definition
Virtual Period Definition
Last Updated 3/8/2012 12:23 AM
One of the features of Cascade Planning is the ability to handle a large number of period columns in a model. Data is stored in a Cascade Planning model in such a way that the period data for one combination (e.g. UK,Widgets, Actual) can be retrieved from a single record, such that the retrieval time for 12 periods is virtually the same as the retrieval time for 60 periods, or 365 periods.
Thus it is not difficult to hold data for say multiple years in the one record. Let's say for example we wished to hold data for 5 years.
We could use a period set with 12 monthly values and a yearly total, and then create a separate dimension to hold the years. There are a couple of problems with this approach.
Firstly, the retrieval speed could be impacted since to hold five years of data, we would need 72 separate records for each combination.
The second problem is that we may require different exchange rates for each year. Cascade supports a different exchange rate for each period and each version.
Conversely, if we store all 72 periods of data, in the one period set, we overcome both of the above problems, but we encounter another problem, related to viewing the model. Every time we view the model, all periods will be displayed, making it difficult to read and difficult analyse in a cube view. If we were able to view the periods grouped conveniently into years this would solve the problem.
This is the purpose of the Virtual Period Definition. It allows us to allocate each period to a member of a 'virtual' dimension (by 'virtual' we mean the dimension does not physically exist, but is present in the user interface). Defining which virtual dimension member a period column belongs to alllows us to then filter what we want to see, or even view the model with the virtual dimension appearing just like any other dimension we can select from.
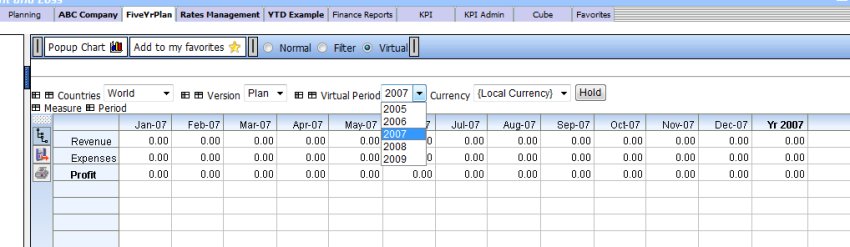
In the example shown below, although we have five years of data in our model, we can select each year to view separately from the 'Virtual Period' dropdown, just as if it were a dimension (although of course it is not).
To create a Virtual Period Definition for a selected global Period Set, go to Planning->System Common->Virtual Period under the Planning tab.
To create a Virtual Period Definition for a selected local Period Set, go to Cascade Planning Help (BASIC)->Modelling->Maintenance->Virtual Period under the Project tab.
The screen will display a dropdown list of the Period Sets available, and by default will show the Virtual Period Definition list for the first Period Set in the list.
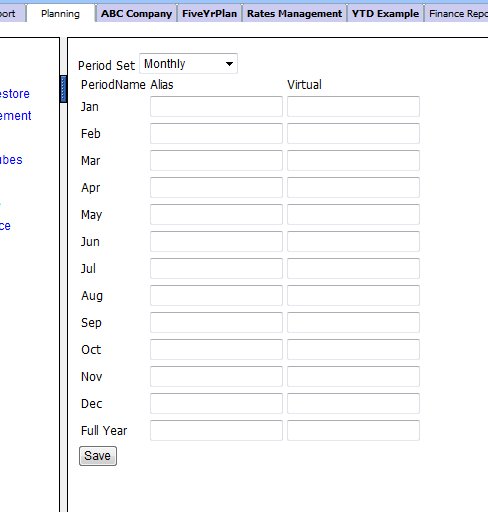
By default the list will be blank since no Virtual Period Definition has yet been provided.
The first column is the period name for each period in the Period Set.
In the second column we can specify an alias for the default period name. This will provide the name to be used when displaying the cube. For example for Jan, we could define the alias as January, and whenever we open the model, the label displayed for Jan will be January.
In the third column, we enter the virtual dimension member name, we want the period to belong to. It is important that the spelling is the same for each period you want grouped together, since any misspelt names will cause the period to be grouped separately.
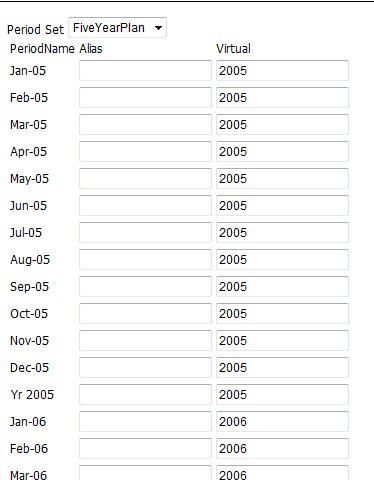
For example in the sample shown below we have a Period Set called FiveYearPlan, which has 12 period for each year plus an annual total. Note that the period names must all be unique, however for display purposes we could use the Alias feature to make each month name the same. However for our example we have left the Alias blank, so each month will be displayed as its name is defined in the period set.
The year name is entered into the Virtual column of each period, as shown:
After all the periods have had the correct virtual name assigned to them, click on the  button at the bottom of the display to save the definitions. button at the bottom of the display to save the definitions.
If we open a model which has a Virtual Period Definition, we can make use of the extra settings on the toolbar to view the model:
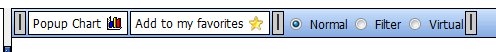
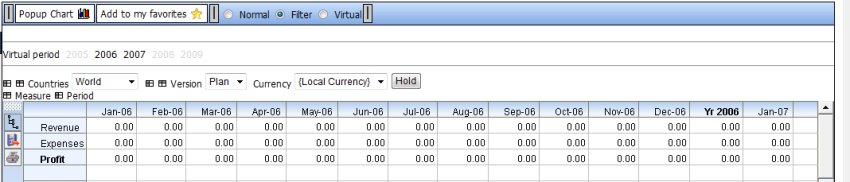
The default display mode is 'Normal' which displays the full period range.
If we change to the 'Filter' view as shown below, the Virtual Period list is displayed underneath the toolbar and shows each Virtual Period dimension member. By clicking on any member, we can exclude or include the periods belonging to that member. For example in the diplay below, we have filtered out the 2005, 2008 and 2009 periods, so that only periods belonging to 2006 and 2007 are viewed.
This is signified by those selections that are 'dimmed' whereas the selections in black indicate the selections included.
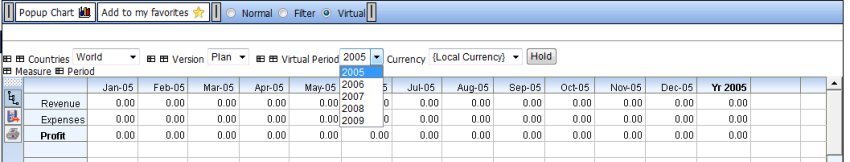
If we change the view to 'Virtual' view as shown in this next example, the Virtual Period member list appears as a dropdown list alongside the other dimension dropdowns, so that we can select the year we wish to view. To view any year in the sequence, we just select the desired year from the drop down.
See also
|


 Page URL: